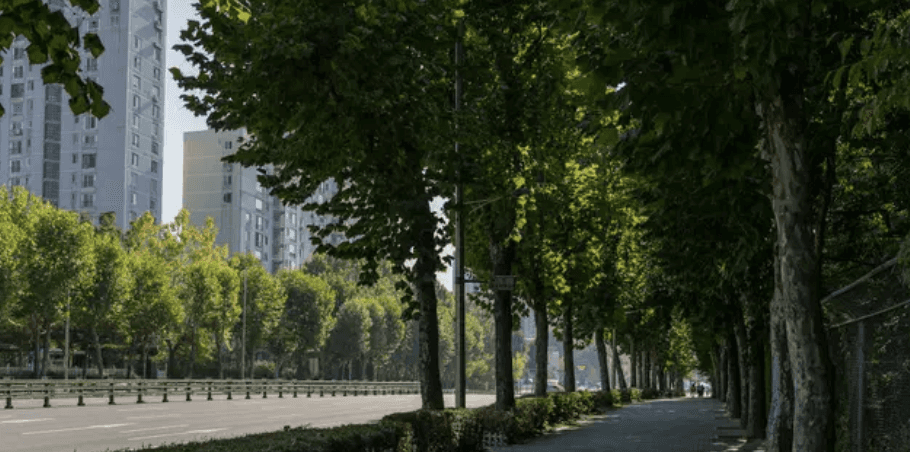
Street trees
By combining the effects of shading and transpirational cooling, street trees create cooler microclimates beneath and around canopies, making outdoor spaces more comfortable for pedestrians.
Mapping Urban Heat Risks

PROJECT:
FOCUS:
ROLE:
YEAR:
THE BIGGER PICTURE
Turning urban heat data into decisions for cooler cities.


Where?
Where is heat concentrated
Who?
Who and what
is exposed
What next?
Where can cooling
interventions make
a difference
WHY HEAT
Cities need more than a temperature map. Decision-makers need to understand where heat is concentrated, who and what is exposed, where interventions could be prioritised, and what those interventions could potentially change.
Extreme heat is spatial.
Evaluate city’s exposure to extreme heat and assess existing conditions.
Identify high-impact areas for cooling infrastructure using pre-defined or custom indices.
Explore customised heat resilience interventions for selected neighbourhoods.
Estimate and understand cooling impact of selected intervention.
THE BUILDING BLOCKS
From insight to impact.
INFORMATION ARCHITECTURE
The challenge wasn't simply organising information but was organising the questions users need to answer. The architecture guides users through four stages: What is happening? Where is the risk? What can we change? What could the impact be?
A complex system, reduced to a clear decision journey.
Baseline
Risk & Opportunities
Solutions
Cool Cities Lab
Impact
Street trees
Cool roofs
Shade structures
Predefined indices Custom indices Priority areas
Hazard
Exposure
Sensitivity
Adaptive Capacity Infrastructure
Baseline
Scenario
Cooling potential
BASELINE
The baseline establishes the context before any intervention is considered by giving users a common starting point for understanding heat exposure, infrastructure and existing conditions.
Start with understanding the city.
Identifies the physical intensity of urban heat across your city.


RISK
The platform combines spatial indicators to help users identify locations where heat risk and opportunities for intervention overlap.
Not every hot place is the same.


From heat maps to priority areas.
SELECT SOLUTIONS
The platform combines spatial indicators to help users identify locations where heat risk and opportunities for intervention overlap.
Not every hot place is the same.
SELECT SOLUTIONS
The platform combines spatial indicators to help users identify locations where heat risk and opportunities for intervention overlap.
Not every hot place is the same.


